ManpowerGroup Employment Outlook Survey Infographic – Q2 2019
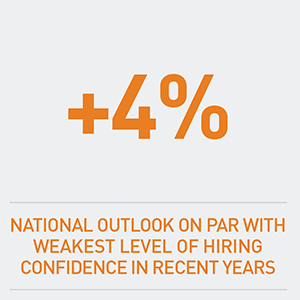
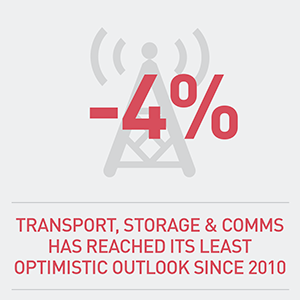
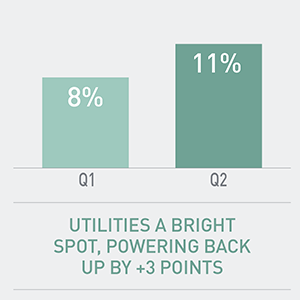
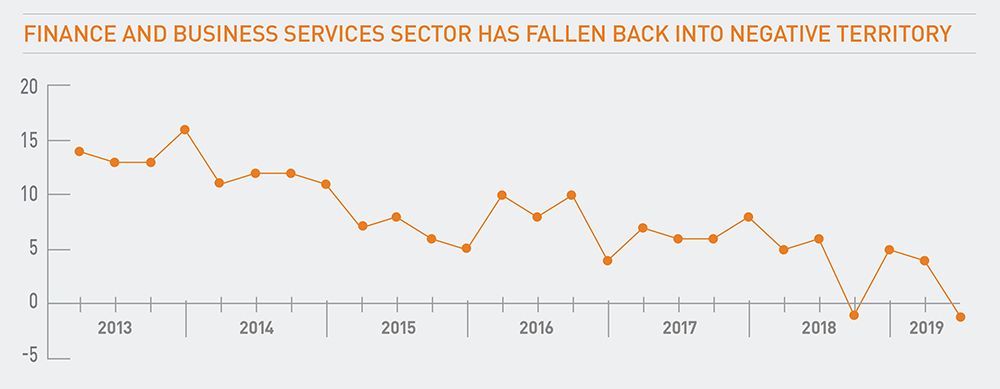
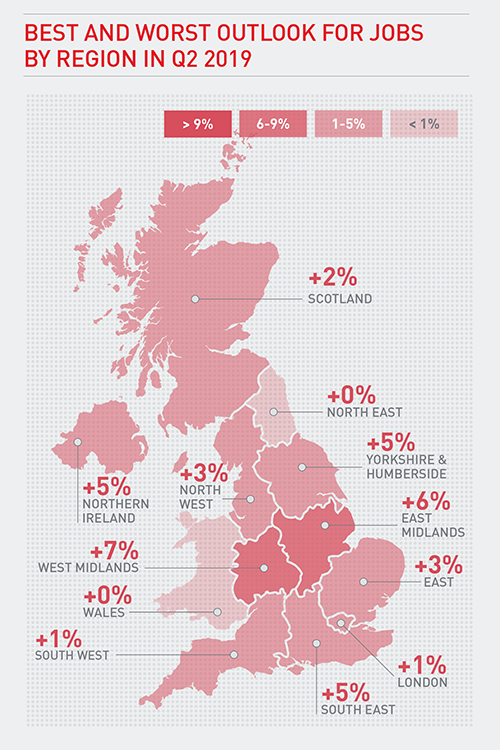
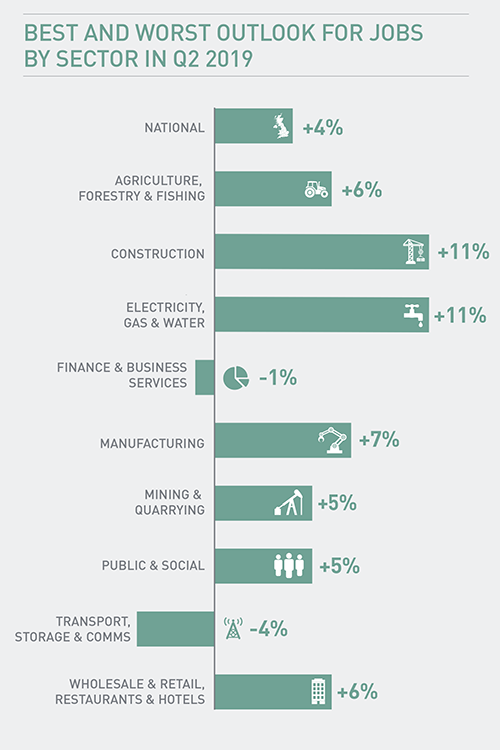
The ManpowerGroup Employment Outlook Survey for the second quarter 2019 was conducted by interviewing a representative sample of 2,124 employers in the UK. This infographic highlights the key takeaways from the Q2 2019 report, including a regional heat map of jobs outlook.

Click here to download the pdf.
What do the percentages mean?
The % of employers anticipating an increase in headcount – the % of employers expecting to decrease in headcount = Outlook Percentage
Seasonally adjusted – Seasonal adjustments are applied to research data to remove employment fluctuations that normally occur at the same time each year, such as the end of a school term or a change in season.


